
Subscription UX
Redesigning the Our Daily Bread devotional subscription experience to create clarity regarding ordering options
My Role
Research, UX/UI, Prototyping, Testing, Dev handoff
Tools
Sketch, Invision, Photoshop, UserZoom
Team
Director of UX, Senior UX/UI designer (that’s me!), Development, Digital Marketing, Order Processing
Timeline
2018
The Challenge
The existing subscription experience for the Our Daily Bread devotional did not make it clear to users that there are two subscription options available: a free quarterly edition, or a monthly edition that's available with a gift of any amount. Most users were signing up for the quarterly edition by default, unaware that another option existed. Because of this, not only were users missing out on signing up for a better subscription experience, but the organization was missing out on vital donations.

Original Subscription Page
The Goals
1. Highlight the differences between the two subscription options
2. Increase awareness and subscription rates for the monthly edition
3. Offer the option to include financial support without pressure

Quarterly Subscription Devotionals

Monthly Subscription Devotionals

Current customer journey for subscribing
Research
Audit of existing Our Daily Bread subscription experience and user journey
Survey of other Subscription or Sign Up experiences across a variety of industries
Evaluation of industry best practices
Spoke with representatives from development, customer contact, and order processing to gain full understanding of current processes and limitations that would impact our work.
Testing
We tested multiple designs and were able to narrow it down to a design comparing the two editions side by side. The preferred design also visually highlighted the monthly edition and gave additional options for ordering at the bottom of the page.
After analyzing tests, designs were modified to reflect what we learned from users to improve the experience. We also coordinated the full roll-out with all connected teams and departments to ensure they were prepared for uptick in monthly subscriptions we predicted the new design would drive.
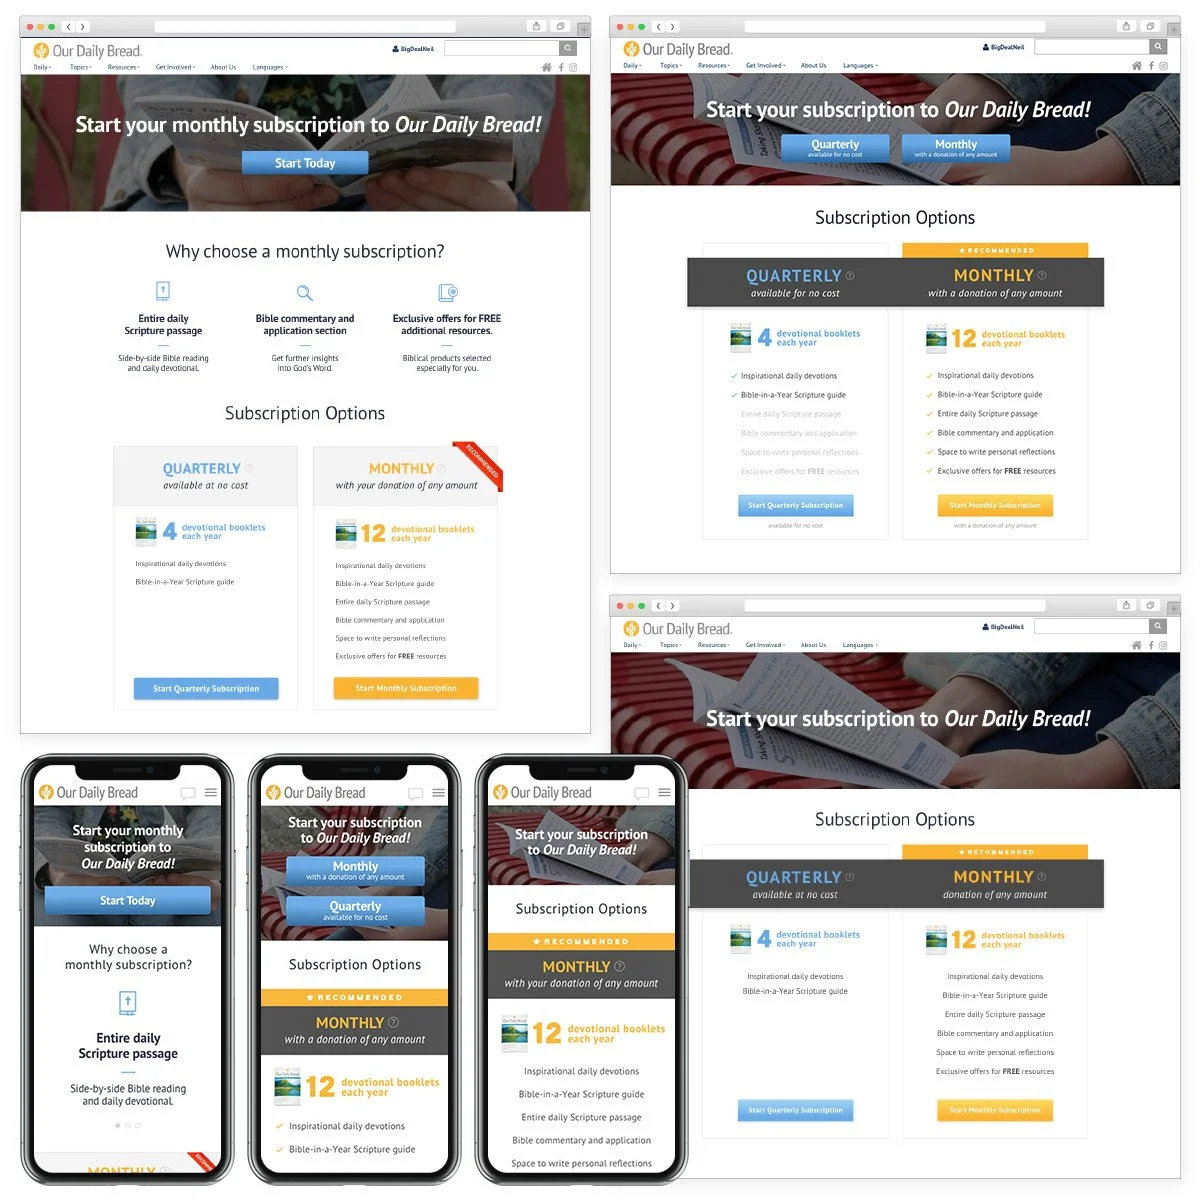
Samples from the multivariate testing
Final Design & Results
After having the updated experience active for a full year, the team reported the following year-over-year statistics:
31% increase in monthly edition subscriptions
826% (🤯) increase in number of donations from subscribers to the quarterly edition
261% increase in overall donation amounts through the subscription experience
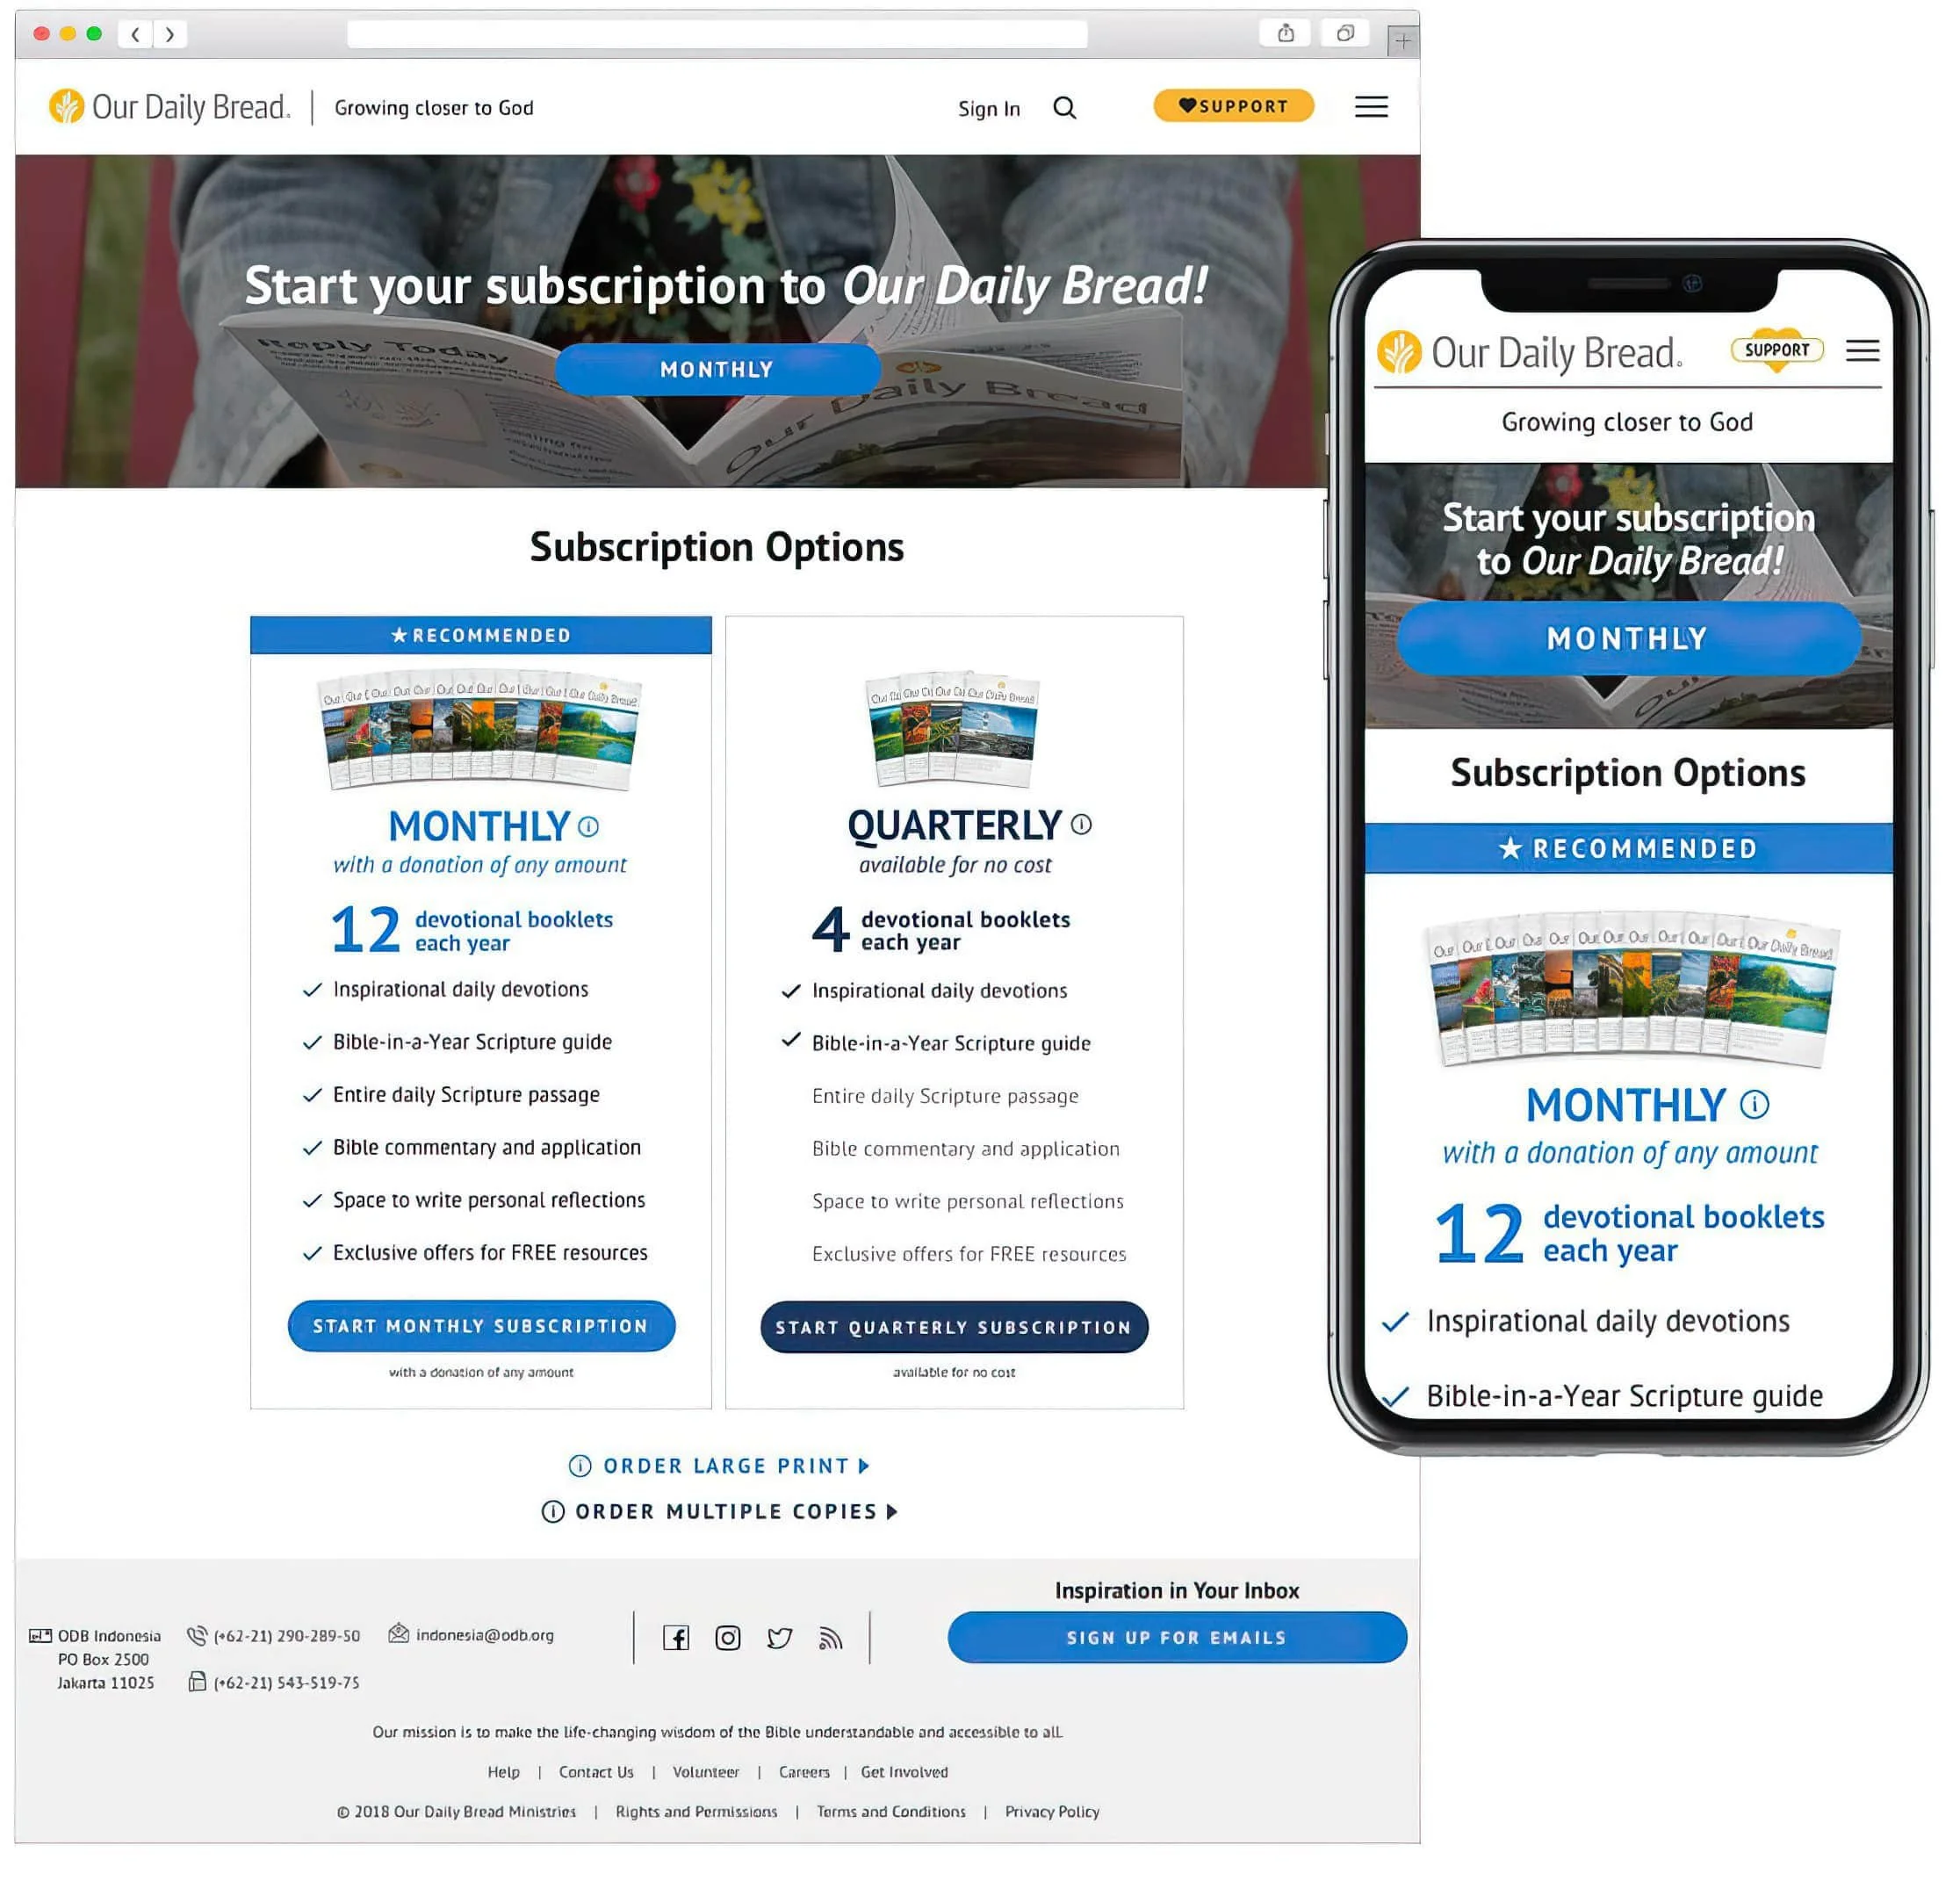
New subscription page design